Hi Everyone,
In the latest Acumatica version 5 we have added 2 powerful tools to help you finding bottle necks while designing your applications at Acumatica Framework.
There could be 3 types of potential areas of interest for developer/consultant.
A. SQL Server. Luckily we have native Microsoft SQL Profiler to address that. So my article will be about the other part. IIS.
B. Internet Information Server Memory resources.
C. Internet Information Server CPU resources.
Memory Profiler.
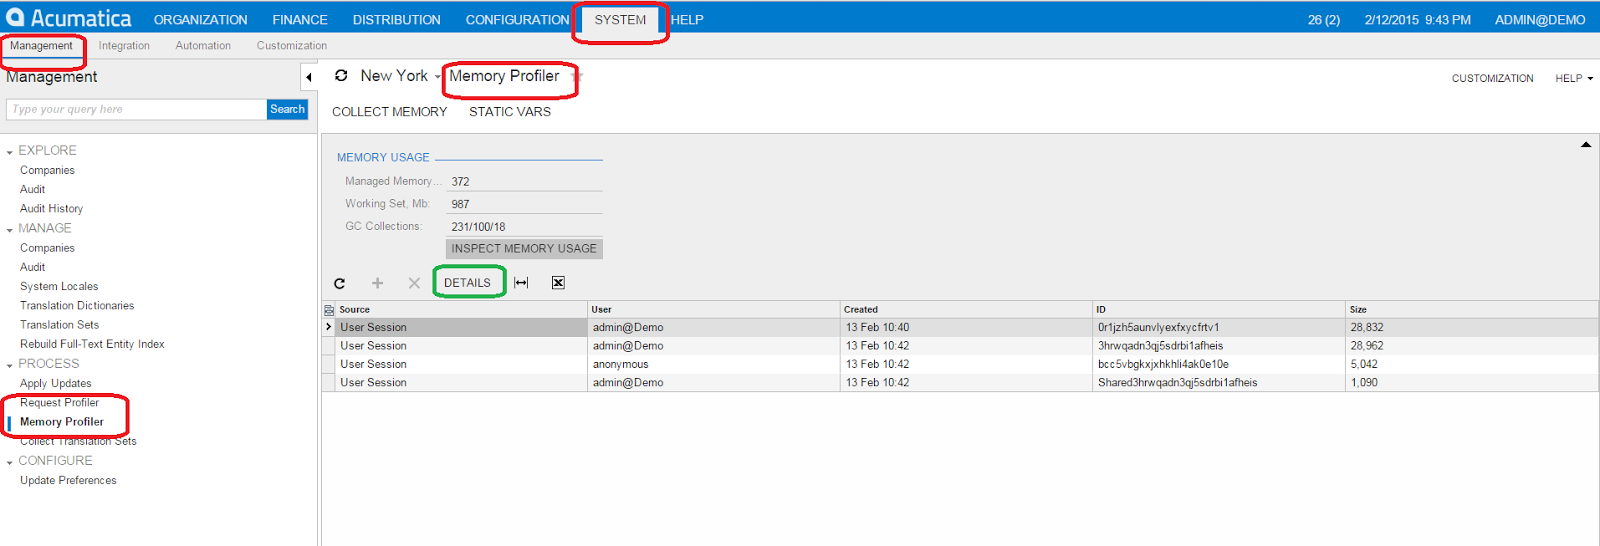
This utility can provide us detailed information on memory usage by the IIS server, with per session tracking.
Once started, screen get the memory snapshot from the IIS. Please pres refresh button on the grid and we will see all the session information.
If we click Details, it will display per session memory usage like below:
On the right side of the screen it shows amount of used memory per process.
Request Profiler.
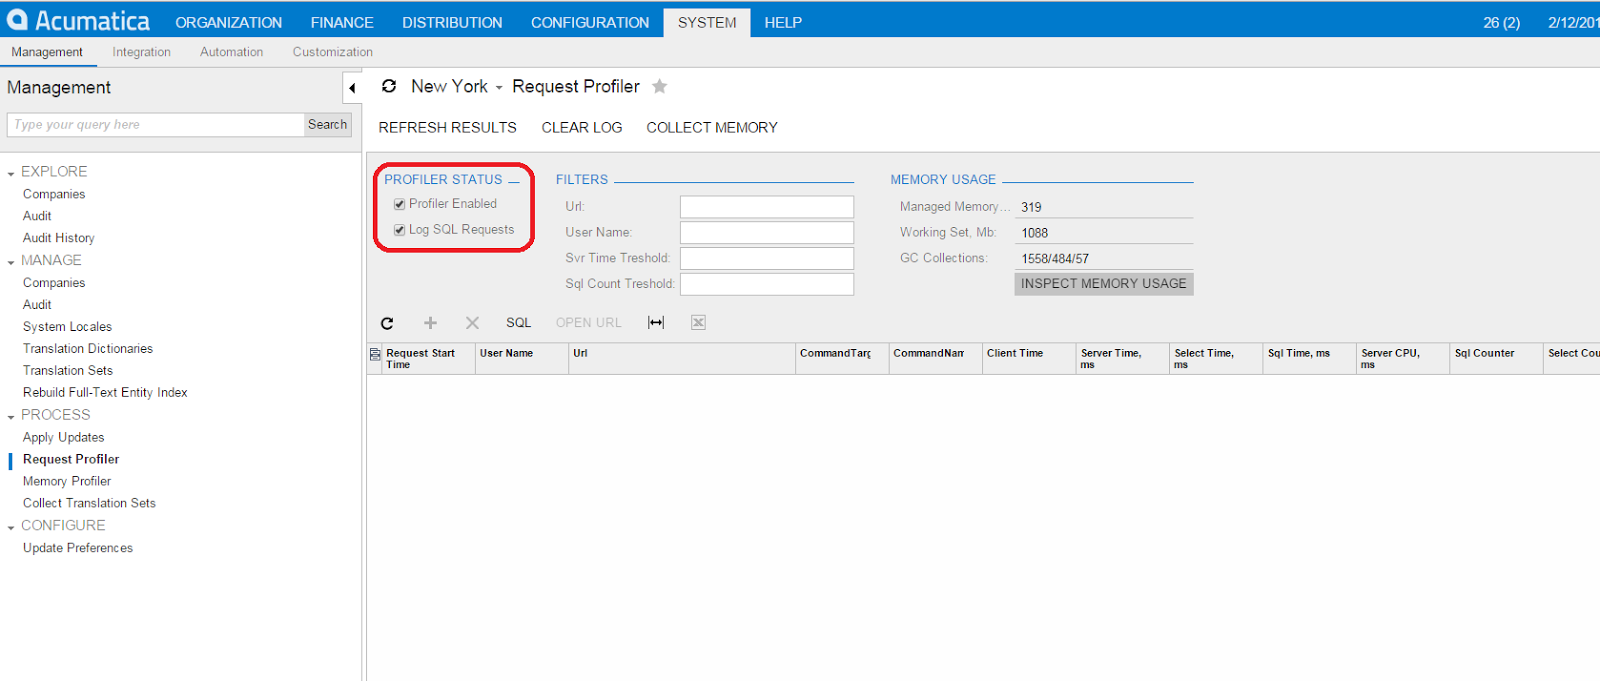
Is a tool to investigate time taken by an IIS request, to execute the business logic or other tasks performed by the user. Once you opened the screen, please make sure check boxes below are ticked.
Then, once you refreshed the results, the grid will populate results. What I have done is run GL Transactions screen, and here is the result:
As you may have noticed, longest process was Release, it took 0.5 sec of the single cpu IIS execution time.
Happy debugging,
Sergey.


